Your Questions, Answered
-
A GEDCOM file is a standard genealogy file format used to move family tree data between genealogy programs and websites. If you have built a tree on a genealogy website or in genealogy software, you can usually export a GEDCOM file from that service.
-
No. Most family trees have missing people, unknown dates, or uncertain locations. A chart can still be created from incomplete data. Missing information can be left blank or handled in a simple, clean way.
-
Heirloom Graphix does not provide genealogical research services directly. If your tree needs more research before it is ready for a chart, we may be able to recommend an independent genealogy partner.
-
Yes. A chart can begin with one person, a couple, or siblings. Sibling-centered charts are especially useful for children or family gifts because multiple family members can share the same heirloom display.
-
A complete five-generation chart includes up to 31 ancestral positions for one starting person. A complete six-generation chart includes up to 63. A complete seven-generation chart includes up to 127. A complete ten-generation chart includes up to 1,023 ancestral positions.
When a chart begins with siblings or more than one central person, the structure may vary slightly depending on the family.
-
Unknown ancestors are normal. The chart can leave those spaces blank, use a placeholder, or simply include the known ancestors. The design will be adjusted to keep the chart clean.
-
Most charts include the person’s name and birth/death years when available. Full dates are usually too detailed for the chart itself, especially in larger generations.
-
A photo-based five-generation chart is available as a separate product. Photo charts require additional image preparation and design work because old and modern photos often need to be visually coordinated.
-
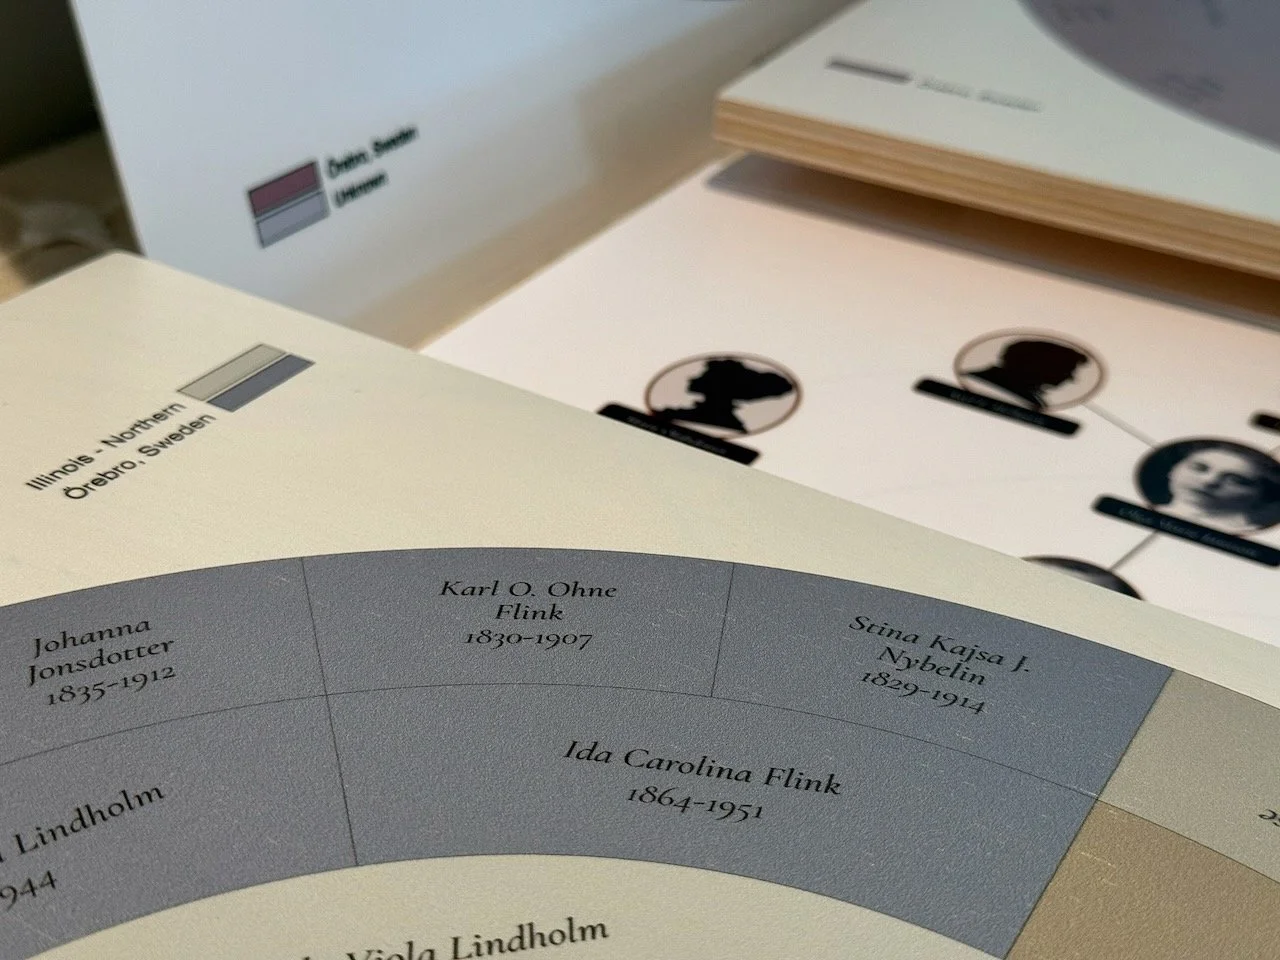
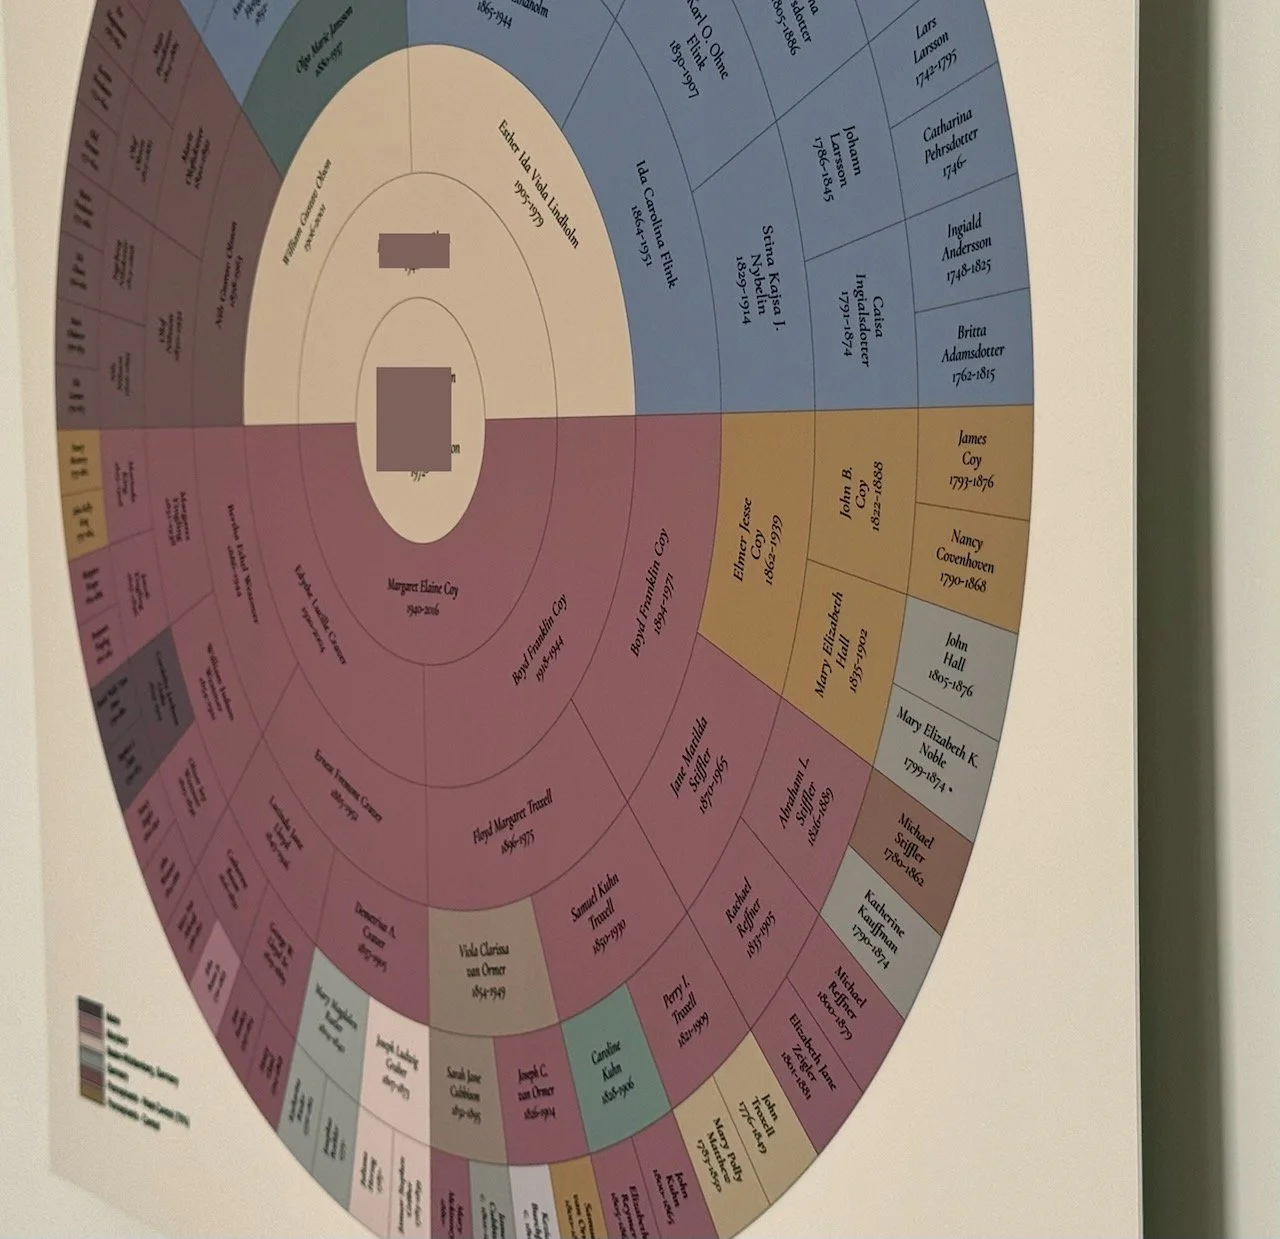
When birthplace information is available, ancestors can be colored by region. This helps show family geography at a glance. For example, a chart may reveal clusters from Sweden, Pennsylvania, New York, Kentucky, or even smaller regions within a state, province, or country.
The color-coding depends on the quality and specificity of the location data in the family tree.
-
Each chart is designed using a curated color system intended to look good in print and maintain readability. You do not need to choose every color. If you would like to compare alternate color treatments, a small set of color previews may be prepared.
-
Birth locations are usually preferred because they better represent ancestry and origin. In some cases, death locations may be used when birth locations are unavailable, but this is handled carefully so the chart does not imply more certainty than the data supports.
-
If birthplace information is missing, the person can still appear in the chart. They may be shown in a neutral color or grouped as unknown.
-
Choose satin metal if you want the crispest, cleanest, most modern appearance. Choose white-finish wood if you want a warmer, softer, more heirloom-like object.
-
No. The charts are designed as frameless wall displays. Metal charts include an inset frame and French cleat system. Wood charts include a wood float hanger.
-
No. These charts are designed for readability, proportion, and visual balance rather than standard frame sizes. Because they are printed as frameless displays, they do not need standard frame dimensions.
-
Each order includes one digital proof and one round of minor corrections before printing.
-
Minor corrections include spelling changes, date corrections, title changes, or small updates to known information. Major changes, such as replacing large branches of the tree, changing the center person, or adding newly researched lines, may require an additional fee.
-
Once the final proof is approved and the chart is sent to print, changes may not be possible. Please review your proof carefully before approval.
-
Timing depends on the condition of the data, the number of generations, revision needs, and printing/shipping time. A typical chart with clean data may move to proof relatively quickly, while charts requiring cleanup will take longer.
-
Yes. These charts make excellent gifts for parents, grandparents, siblings, weddings, anniversaries, family reunions, memorials, and milestone birthdays.
-
Yes, shipping directly to a recipient may be possible. If the chart is a gift, please make sure all proofing and approval steps are completed before it is sent to print.
-
Heirloom Graphix charts are created from the family data provided by the client. Chart creation does not verify any genealogical relationship, date, or location.
Clients are responsible for reviewing proofs carefully. If research verification is needed, we may be able to recommend an independent genealogy partner, but Heirloom Graphix does not provide genealogical research services directly.
-
When birthplace information is available, the chart can use color to show where ancestors were born. The goal is not to create a precise map of every town, but to reveal meaningful geographic patterns across the whole family tree.
For larger regions that appear often, such as Pennsylvania, Sweden, New York, or England, the chart may divide that region into subregions when the available data supports it. This can help show movement and clustering within a broader ancestral area without turning the chart into a confusing patchwork of tiny categories.
The amount of detail depends on the family data and the chart itself. If a region appears only once or twice, it may not need to be divided. If a region makes up a large portion of the chart, subregions may make the ancestry pattern more informative. When location details are incomplete, those ancestors may be grouped more broadly or shown in a more neutral way.
The purpose of the color system is balance: enough detail to make family geography visible, but not so much detail that the chart becomes hard to read.
-
Yes. If there are specific regions or subregions that matter to your family story, you can request that they be included when the chart is prepared.
For example, you might want to distinguish:
• Eastern and western Pennsylvania
• England, Scotland, Wales, and Ireland
• Different branches that came from different parts of the same state or country
This is especially useful when a broad label would hide an important family pattern. If most of your ancestry comes from one region, subregions can help show movement, clustering, or differences between family branches.
Some requests may depend on the available data. If the family tree only lists “Pennsylvania” without county or town information, the chart may not be able to divide those ancestors into more specific subregions. But when the data supports it, specific subregions can be intentionally included.
-
Yes. Heirloom Graphix can create charts for families with ancestry from anywhere in the world, as long as the family data is available in a usable format.
When birthplace information is included, the chart can use regional color-coding to show broad patterns of family geography. At the simplest level, this might mean showing different countries, states, provinces, or major regions.
Some areas can also support more detailed subregion color-coding. This is especially useful when a large portion of the chart comes from one country, state, or region and a broad label would hide important family patterns.
Subregion support is currently strongest for:
• United States
• Canada
• Japan
• Western Europe
• Central Europe
For example, a chart may be able to distinguish different parts of Pennsylvania, counties or historical regions within Sweden, regions within Germany, or different prefectures in Japan, depending on the detail available in the family data.
Subregion detail always depends on the information provided. If the family tree lists only a country or state, the chart may need to use that broader region. If the tree includes counties, towns, parishes, prefectures, provinces, or similar location details, more specific regional patterns may be possible.
What is a GEDCOM file?
A GEDCOM file is a standard genealogy file format used to move family tree data between genealogy programs and websites. If you have built a tree on a genealogy website or in genealogy software, you can usually export a GEDCOM file from that service.
Do I need a completed family tree?
No. Most family trees have missing people, unknown dates, or uncertain locations. A chart can still be created from incomplete data. Missing information can be left blank or handled in a simple, clean way.
Can you help research missing ancestors?
Heirloom Graphix does not provide genealogical research services directly. If your tree needs more research before it is ready for a chart, we may be able to recommend an independent genealogy partner.
Can the chart start with more than one person?
Yes. A chart can begin with one person, a couple, or siblings. Sibling-centered charts are especially useful for children or family gifts because multiple family members can share the same heirloom display.
How many people are included?
A complete five-generation chart includes up to 31 ancestral positions for one starting person. A complete six-generation chart includes up to 63. A complete seven-generation chart includes up to 127. A complete ten-generation chart includes up to 1,023 ancestral positions.
What if some ancestors are unknown?
Unknown ancestors are normal. The chart can leave those spaces blank, use a placeholder, or simply include the known ancestors. The design will be adjusted to keep the chart clean.
What information appears for each person?
Most charts include the person’s name and birth/death years when available.
Can you include photos?
A photo-based five-generation chart is available as a separate product. Photo charts require additional image preparation and design work because old and modern photos often need to be visually coordinated.
How does the location color-coding work?
When birthplace information is available, ancestors can be colored by region. This helps show family geography at a glance. For example, a chart may reveal clusters from Sweden, Pennsylvania, New York, Kentucky, or even smaller regions within a state, province, or country.
The color-coding depends on the quality and specificity of the location data in the family tree.
What if birthplaces are missing?
If birthplace information is missing, the person can still appear in the chart. They may be shown in a neutral color or grouped as unknown.
Can you use death locations instead of birth locations?
Birth locations are usually preferred because they better represent ancestry and origin. In some cases, death locations may be used when birth locations are unavailable, but this is handled carefully so the chart does not imply more certainty than the data supports.
Can I choose the colors?
Each chart is designed using a curated color system intended to look good in print and maintain readability. You do not need to choose every color. If you would like to compare alternate color treatments, a small set of color previews may be prepared.
Why do you use regional color-coding instead of exact cities?
Exact cities or towns would create too many categories and make the chart visually chaotic. Regional color-coding preserves meaningful geographic patterns while keeping the chart readable. That said, if you have ancestors from a particular city, the chart can be designed to reflect that.
What material should I choose?
Choose satin metal if you want the crispest, cleanest, most modern appearance. Choose white-finish wood if you want a warmer, softer, more heirloom-like object.
Do the charts need to be framed?
No. The charts are designed as frameless wall displays. Metal charts include an inset frame and French cleat system. Wood charts include a wood float hanger.
Are the sizes standard frame sizes?
No. These charts are designed for readability, proportion, and visual balance rather than standard frame sizes. Because they are printed as frameless displays, they do not need standard frame dimensions.
How many proofs are included?
Each order includes one digital proof and one round of minor corrections before printing.
What counts as a minor correction?
Minor corrections include spelling changes, date corrections, title changes, or small updates to known information. Major changes, such as replacing large branches of the tree, changing the center person, or adding newly researched lines, may require an additional fee.
Can I make changes after approving the proof?
Once the final proof is approved and the chart is sent to print, changes may not be possible. Please review your proof carefully before approval.
How long does the process take?
Timing depends on the condition of the data, the number of generations, revision needs, and printing/shipping time. A typical chart with clean data may move to proof relatively quickly, while charts requiring cleanup will take longer.
Can this be a gift?
Yes. These charts make excellent gifts for parents, grandparents, siblings, weddings, anniversaries, family reunions, memorials, and milestone birthdays.
Can you ship directly to the recipient?
Yes, shipping directly to a recipient may be possible. If the chart is a gift, please make sure all proofing and approval steps are completed before it is sent to print.
Important note about genealogical accuracy
Heirloom Graphix charts are created from the family data provided by the client. Chart creation does not verify any genealogical relationship, date, or location.
Clients are responsible for reviewing proofs carefully. If research verification is needed, we may be able to recommend an independent genealogy partner, but Heirloom Graphix does not provide genealogical research services directly.